
How to Read a Mining Pool Statistics Page
A decent statistics page answers one question: does the number it shows match what your hashrate should have produced? At 1 PH/s and a difficulty of 132.76 T, the expected output is 0.00001973 BTC an hour, about $1.68 at $85,294 per BTC, or 0.00047353 BTC across 24 hours. Read the page in a fixed order and that comparison takes less than a minute each morning.

Key takeaways
- Start with network difficulty, 132.76 T on 22 Sept 2026, because it is the denominator in every revenue figure on the page.
- 1 PH/s is 0.000105% of an implied network hashrate of 950.3 EH/s, which is what makes the hourly figure 0.00001973 BTC.
- The Pool Hashrate figure tells you whether the pool is still holding the share of the network that your estimate assumes.
- Settlement cadence belongs on the same screen: PPS+ credits hourly at current difficulty, while PPLNS pays after 6 confirmations spread over the last 5 difficulty rounds.
The four numbers that carry the whole page
Most of what a statistics page displays is context. Four figures do the work. Network difficulty is the first, because it converts hashrate into a revenue estimate. That number stood at 132.76 T on 22 Sept 2026, with the next adjustment estimated at +1.90%. The implied network hashrate from that difficulty is 950.3 EH/s, while an independent 3-day average of 942.8 EH/s runs about 0.8% lower, which is a useful reminder that the two ways of counting the network rarely agree to the decimal.
The second figure is the Pool Hashrate, which places the pool inside that network. The third is your reported hashrate, which should be reconciled against your own worker list rather than trusted on its own. The fourth is the balance and settlement line, which tells you what has actually been credited rather than what has been mined. Everything else on the page is served for context.
Why the reading order matters
Read the page backwards and small shifts look alarming. A flat day for your balance during a difficulty rise is arithmetic, not a fault. A jump in Pool Hashrate that does not move your share upward is growth arriving from someone else's machines. A drop in your reported hashrate combined with an unchanged Pool Hashrate usually means the problem is local: a machine down at your site, not a fault at the pool.
Take the same diagnosis the other way round. If reported hashrate is steady and the payout line is short, the cause is almost always the settlement rule rather than lost shares. A PPLNS window that has not produced a block in the last few hours pays nothing, however healthy the hashrate looks, while the same machines on an hourly PPS+ schedule would already show 0.00001973 BTC per PH/s for each hour worked. Comparing two identical miners on different schedules for a single day is therefore a variance measurement, not a performance measurement.
What each field is for
The table below is the checklist to walk through, in order, with the value you would find at 22 Sept 2026 inputs.
| Field | Question it answers | Benchmark on 22 Sept 2026 |
|---|---|---|
| Network difficulty | How hard is a block right now | 132.76 T, next adjustment estimated +1.90% |
| Pool Hashrate | How much of that network sits in this pool | Compare against the 950.3 EH/s implied network total |
| Your reported hashrate | Is the hashrate you pay for arriving | 1 PH/s should yield 0.00047353 BTC a day |
| Settlement line | Was that output actually credited | PPS+ hourly at 0.00001973 BTC per PH/s per hour |
Two of those rows move slowly and two move fast. Difficulty and Pool Hashrate change on the order of days and weeks, which makes them planning inputs. Your reported hashrate and the settlement line change within minutes and are operational inputs. Confusing the two is the most common way a dashboard reading goes wrong.
Worked example
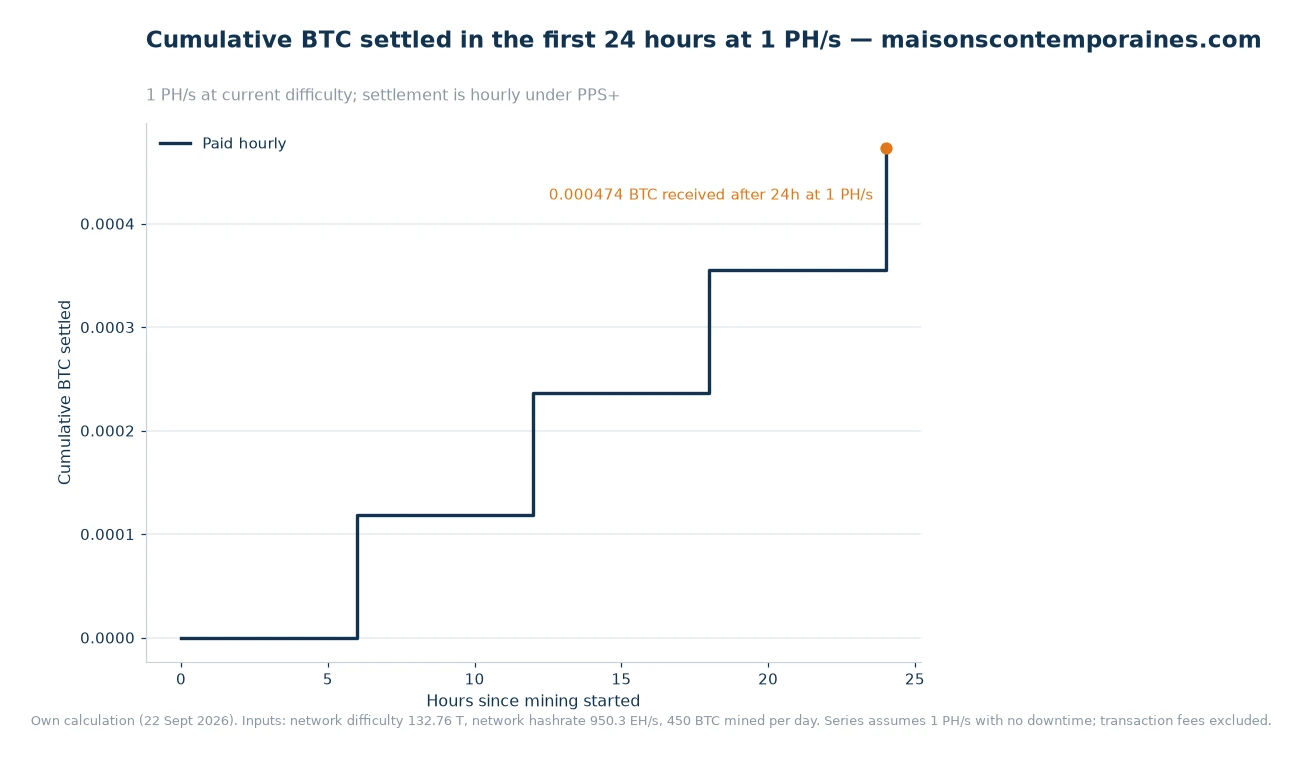
Walk a single day of 1 PH/s through an hourly settlement and see what the page should show. Output per PH/s per day at this difficulty is 0.00047353 BTC, so per hour it is 0.00001973 BTC, which is $1.68 at $85,294 per BTC.
- By hour 6 the cumulative credited total should be 0.00011838 BTC, or about $10.10.
- By hour 12 the total reaches 0.00023676 BTC, about $20.20.
- By hour 18 it stands at 0.00035515 BTC, about $30.29.
- At hour 24 the full day is 0.00047353 BTC, which is $40.39 gross.
- After the listed 4% on the block-reward component the net figure is $38.77, so the day's fee line is about $1.62.
- Scale it: 10 PH/s multiplies each of those figures by ten, so the same 24 hours settle $403.89 gross and $387.74 net.
Where those figures come from
Every number above is arithmetic from three inputs: network difficulty, the 3.125 BTC block subsidy paid across 144 blocks a day, and the BTC price. That is also the reason the ViaBTC Mining Statistics page is worth reading in that order, difficulty first and balance last, because the first input sets the scale of everything else. On the same page it helps to know which cadence applies to your account, since the settlement line is only interpretable against the payment method attached to it.
Once the reading is routine, close the loop with the money side. Push the same hashrate and difficulty into the Profit Calculator and see whether the estimate agrees with the credited line, and check that mining income and any conversions land in the same account by keeping the payout address pointed at a multi-currency wallet. A reading that disagrees with the payout is usually a stale difficulty input rather than a lost share, and a page that shows both difficulty and credited output makes that visible.
Frequently asked questions
How often should a statistics page be checked?
Once a week is enough for planning, and daily if you are reconciling worker uptime or chasing a drop in reported hashrate.
Why does the balance not move every hour under PPLNS?
Because PPLNS credits a round only once a block has 6 confirmations, and the window covers the last 5 difficulty rounds, so quiet hours are normal rather than a fault.
Which figure on the page should be trusted most?
Network difficulty, because it is measured from chain data rather than from a dashboard and it sets the value of every other figure shown.
Make it a two-minute routine
Read difficulty, then Pool Hashrate, then your own reported hashrate, then the settlement line, and write the four down once a week. After a month you will know what your normal looks like, and an abnormal reading will stand out without any interpretation. Keep the arithmetic in the same note so that a change in the BTC price or an adjustment in difficulty can be applied to the whole history at once. The page is a measurement instrument, and like any instrument it is most useful when read the same way every time. Keep the same four columns on the same sheet, and add a fifth for the BTC price of the day, so that a month from now the difference between two weeks is explained by an input rather than by a feeling about the pool.
Where the numbers came from: the pool statistics page linked above[1] together with the fee schedule behind the 4% and 2% rates, a difficulty reading of 132.76 T, an implied network hashrate of 950.3 EH/s, 144 blocks a day paying 3.125 BTC each and a BTC price of $85,294, all read 22 Sept 2026. Difficulty and price are the two inputs most likely to have moved since then, so re-check both before reusing any total from this page.